|
   
August, 2003
(modified
May 2004)
Over/Underexposing
Video
by Dan
Coplan
Over/Underexposing Video
In the video camera realm, the
warning is very clear: "Protect your highlights!",
and it's common to underexpose your image for the sake of doing
so. Word on the street has it that bringing your image back up
from underexposure is a lot easier than bringing it down from
overexposure.
I never questioned this popular belief and have been following
this rule of thumb, but never really saw any proof by way of
analytical comparison. Taking a break from the endless number
of producers beating down my door to shoot their feature... ...I
put on my lab coat and goggles and plunged into the proof of
the pudding.
I set up my DVX-100 on a tripod square to a DSC Labs 11-step Front Box chip chart and
ran a firewire cable from the camera to Final Cut Pro on my iBook.
I used the waveform monitor available in FCP's "Log and
Capture" mode to insure the chart was evenly lit and to
analyze the luminance levels being read by the camera.
NORMAL exposure
 
Using the camera's linear CINE gamma setting and the waveform
monitor, I optimized the latitude of the camera by exposing the
white chips on the chart to read right around 100 IRE. I then
dialed down the camera's MASTER PEDESTAL to -9, the point at
which the blacks hit 0 IRE without crushing.
Note: The black levels of the chart
maintain reflective properties. Measured against non-reflective
"cavity black" material, black levels are actually
several IRE units lower. While this test was done using the chart's
black levels as a reference, it should be noted that they don't
reflect (no pun intended) the blackest black. Setting your master
pedestal to the level I set for this test may result in unintentional
crushing of the blacks. It's good practice, in any case, to avoid
setting your blacks too low. It's better to keep them at a level
that insures information in the shadows and you can always pull
them down in post.
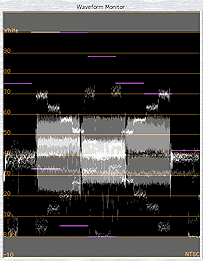
The above chart shows the increase/decrease of chip luminance
values in equal amounts. This is verified by the adjacent waveform
reading that displays fairly evenly spaced luminance values with
the crossover (the middle gray chip shared as a common value
between the upper and lower row of chips) just a smidge higher
than 50 IRE or true middle gray.
OVER exposure +1 STOP
 
This is a 1-stop difference from f8 to f5.6! The whole upper
range of the camera has disappeared into oblivion. Where you
count 5 distinct steps with detail from middle gray into white
on the NORMAL chart, this chart displays 3 distinct steps and
the 3rd step doesn't hold any information aside from pure white.
Middle gray jumped over 10 IRE and while the darkest black struggles
to maintain its roots, the shadow range is pulled up and going
milky. If there's any saving grace, it's that the colors, while
a little washed out, are significantly more vibrant in this overexposed
chart than the NORMAL chart.
OVER exposure +2 STOPS
 
Fuhgedaboudit. Middle gray approaches the highlight limit at
roughly 95 IRE. The blacks do an admirable job of hanging in
there, but can't help going skim.
UNDER exposure -1 STOP
 
Here's where it gets interesting. This chart was exposed one
stop under from f8 to f11. Rather than dunking a quarter of the
image into pure black the way the overexposed chart turned over
the highlights to pure white, this chart maintains distinct separation
between every chip throughout the scale. Highlight detail is
compressed and the overall image loses contrast, but there's
something to work with. All is not lost!
UNDER exposure -2 STOPS
 
The image is murky. There are no highlights to give sparkle and
presence. The deepest shadows are blending together into a black
void, but it's still all there! Sure, the blackest black is crushed
into nothingness, but you can still see separation between every
chip on the chart and you can count every single chip on the
waveform monitor. The 2 stops overexposed chart gave us 7 out
of 11 steps of separation. This chart gives us 11 out of 11 steps.
 This is the chart I plotted based on pixel
sampling from the video captured chip chart. It gives a quick
visual reference as to the behavior of over and underexposed
video. This is the chart I plotted based on pixel
sampling from the video captured chip chart. It gives a quick
visual reference as to the behavior of over and underexposed
video.
I'd love to hear your feedback. Shoot me an e-mail at infoNOSPAM@dancoplan.com
(remove 'NOSPAM' from the e-mail address).
* I used a Panasonic DVX-100 video camera for this testing. If you're interested in finding out how this camera employs different gamma settings, check out my article, "DVX-100 Gamma Settings".
Copyright ©2003. Dan
Coplan
This article was originally published at
DanCoplan.com and is
reprinted here with permission.
All screen captures
and textual references are the property and trademark of their
creators/owners/publishers.
|